Sales Analytics Dashboard
One live dashboard pulling from all your sales channels, auto-updating — so your data is never stale.
Dashboard Panels
What I Track
A sales dashboard should give you answers in seconds, not create more questions. Here's every panel I build to keep your finger on the pulse.
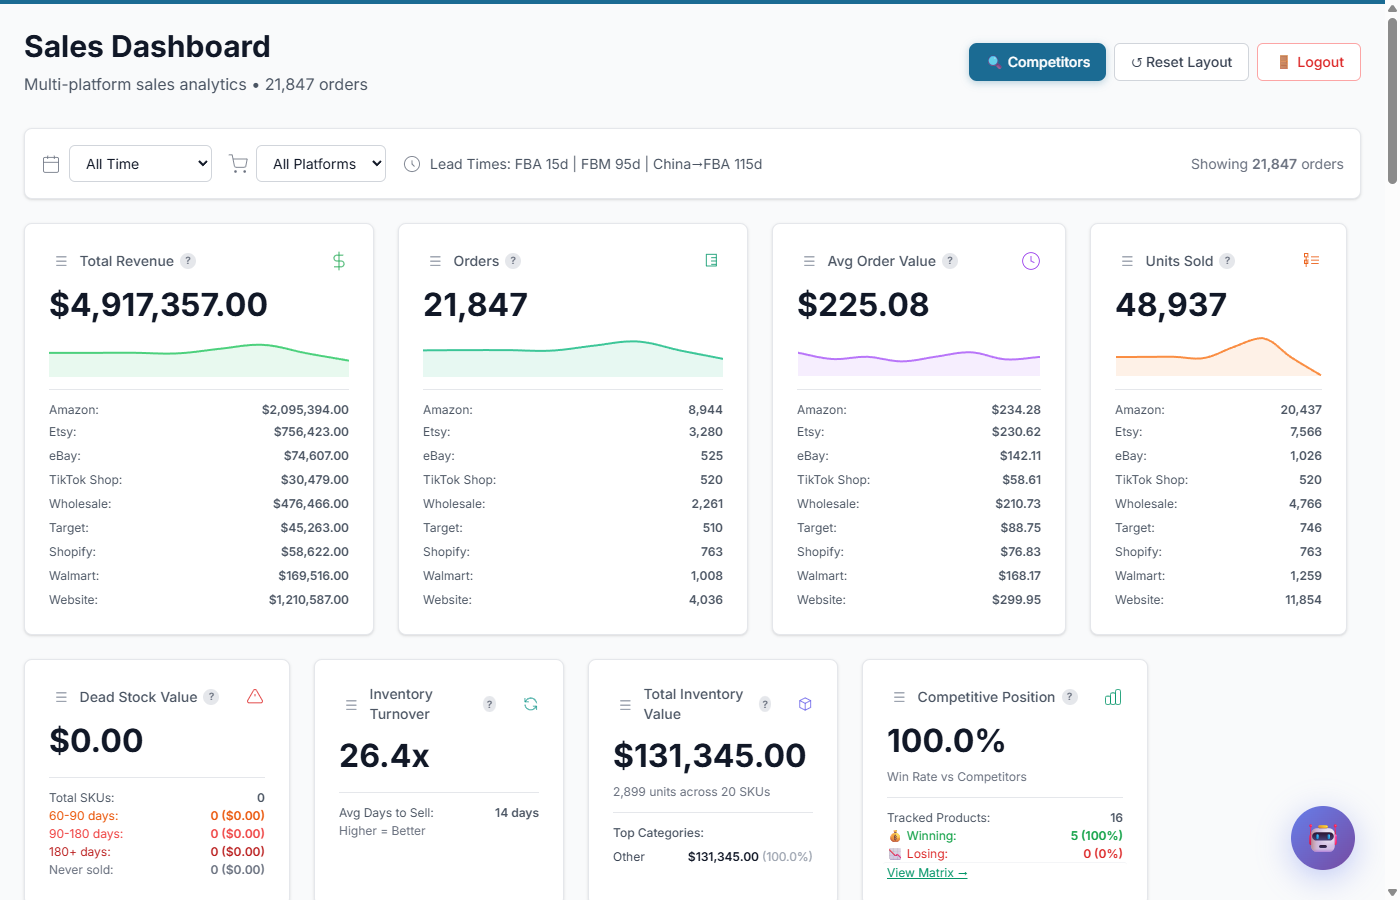
Multi-Channel Revenue
Unified view across Amazon, eBay, Walmart, website, wholesale, and more — one source of truth.
- 9+ channel aggregation
- Channel-level revenue breakdown
- Real-time data pipeline
Product Analytics
Deep-dive into individual product performance with units, revenue, and margin breakdowns.
- Top/bottom performer identification
- Product-level margin tracking
- Category revenue breakdown
Order & Fulfillment Metrics
Orders processed, fulfillment speed, return rates, and customer satisfaction tracking.
- Daily order volume tracking
- Fulfillment SLA monitoring
- Return rate trend analysis
Trends & Comparisons
Period-over-period comparisons showing whether you're up, down, and by how much.
- Week-over-week trend arrows
- Month & year comparisons
- Seasonal overlay charts
Automated Pipeline
Zero-touch data collection from all sources — the dashboard updates itself, no manual work.
- Scheduled data pulls from all channels
- Automated cleaning & normalization
- One-click deploy to live dashboard
Alert & Anomaly Detection
Smart alerts when something unusual happens — revenue dips, conversion drops, or inventory problems.
- Configurable threshold alerts
- Statistical anomaly detection
- Same-day problem awareness
Track Record
Real Results
9
Sales Channels Unified
Amazon, Walmart, eBay, website, wholesale, and more — all in one dashboard
Multi-Million
Revenue Tracked
Annual revenue flowing through the dashboard with full channel attribution
Daily
Auto-Refresh Cycle
Data pipelines run automatically every day — no manual triggers needed
<5s
Page Load Time
Static S3 hosting means instant loads — no server spin-up, no waiting
These aren't mockups — this is a production dashboard powering real business decisions every day.
Deliverables
What You Get
Real-time KPI dashboard
Revenue, units sold, average order value, and conversion rate at a glance.
Multi-channel revenue view (Amazon/eBay/Walmart/website)
Unified view with channel-level breakdown and trend lines.
Interactive Chart.js charts
Hover tooltips, zoom, filter by date range — all interactive.
Heatmaps for competitive landscape
Color-coded grids showing where you win and lose on pricing.
Mobile-friendly responsive design
Check your KPIs on your phone, tablet, or desktop — looks great everywhere.
S3-hosted (no server needed)
Static hosting on AWS S3 — pennies per month, 99.99% uptime, instant load.
Scope & Pricing
Every Project Is Different
I scope every engagement individually based on your data, goals, and timeline. No cookie-cutter packages — just a solution built around what you actually need.
Data Volume
Number of SKUs, pages, or data points to process drives the scope of the project.
Delivery Format
Raw CSV, live dashboard, API integration, or automated reporting — each has different complexity.
Ongoing Support
One-time delivery versus ongoing monitoring, maintenance, and iteration on results.
Process
How It Works
Discover
Map all your sales channels, data sources, and the KPIs that actually matter to your business decisions.
Connect
Build automated data pipelines from every channel — APIs, exports, scrapers — into a unified data format.
Build
Design and deploy your custom dashboard with interactive charts, filters, and drill-down capability. Hosted and accessible from any device.
Automate
Set up scheduled refreshes, anomaly alerts, and weekly email summaries. The dashboard runs itself — you just read the insights.
Deep Dive
Expert Insight
KPI Selection: Less Is More
The biggest dashboard mistake is showing everything. A screen with 40 metrics means nobody focuses on what matters. The best dashboards answer 3-5 questions: Are we hitting our revenue target? Which channel is underperforming? What needs immediate attention?
I design dashboards in layers: a top-level summary with 5-6 KPIs, then drill-down views per channel or product category. The executive view takes 10 seconds to scan. The detail view is there when you need to investigate.
Refresh Frequency: Real-Time Is Overrated
Real-time dashboards sound impressive but rarely change decisions. If you check sales once a day, a dashboard that refreshes every hour is already overkill. Match refresh frequency to decision frequency: daily refresh for strategic KPIs, hourly for operational metrics like inventory, and near-real-time only for things like ad spend caps where every minute costs money.
Ready for a dashboard you own — no monthly fees?
Stop paying for Tableau or Power BI. Let's build a dashboard that's yours forever.
Get in Touch